What day trading is—and what it is not
Day trading means opening and closing a position during the same trading day. Participants try to work with short-term changes in price and liquidity rather than holding for a multi-month investment thesis. The holding period can be minutes or hours, but the defining feature is that exposure is closed before the session ends.
It is not a shortcut to financial independence. An active ticker can still have poor liquidity, unreliable price discovery, a wide spread, or no sensible place to define risk. Good software reduces information friction; it does not create certainty or replace judgment.
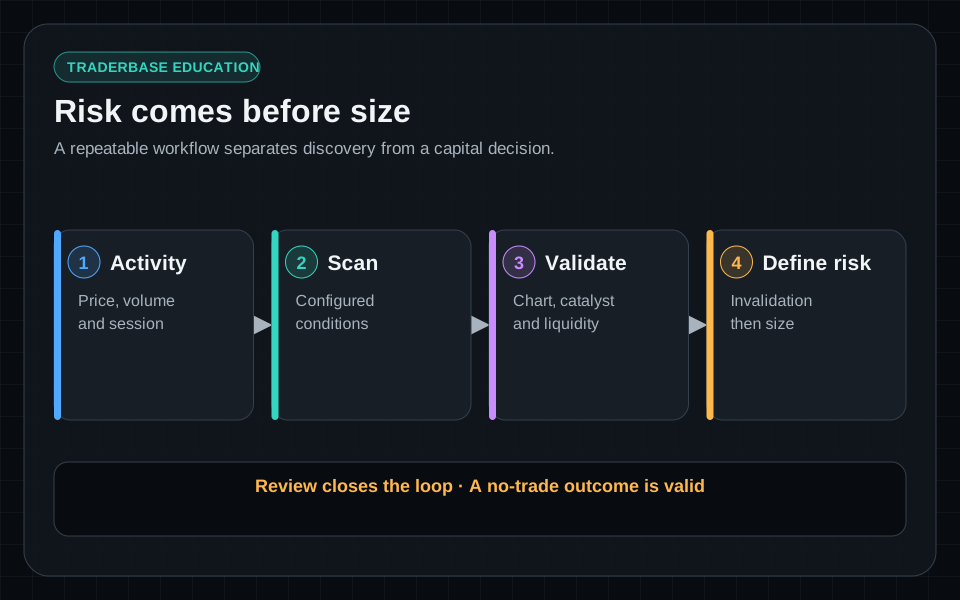
Know the machinery behind the chart
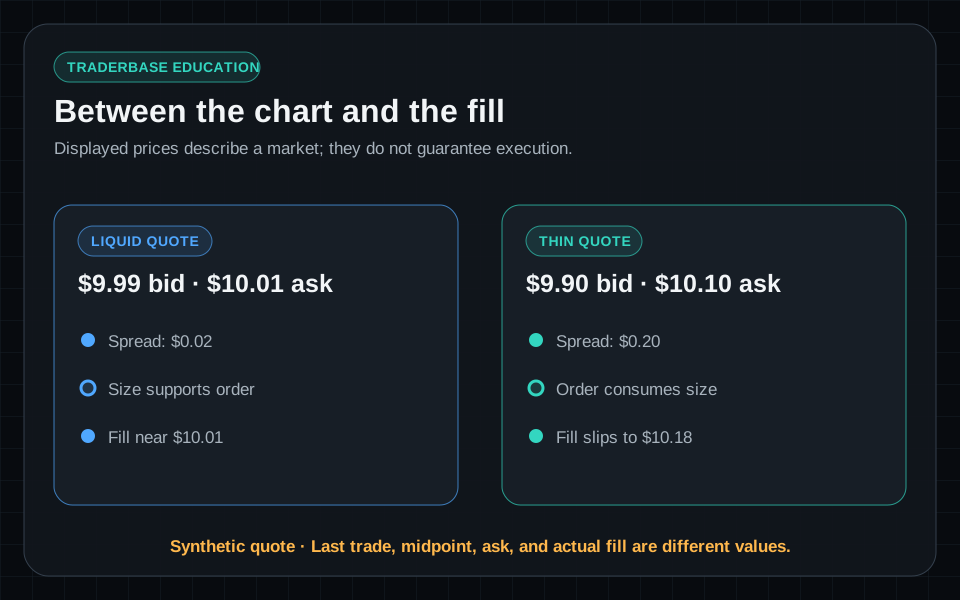
Intraday price is shaped by orders interacting across exchanges and trading venues. The displayed last price is only one print; the bid, ask, spread, available size, and pace of trades help explain what it may cost to enter or exit.
Liquidity
The ability to transact without causing a large price change. Thin books can turn a planned small loss into a much larger one.
Spread
The gap between the best displayed bid and ask. It is an immediate friction cost and often expands in volatile names.
Slippage
The difference between an expected price and the actual fill. Stops and market orders do not guarantee a specific price.
Trading halt
A temporary pause can interrupt exits and reopen at a very different price. Halt risk belongs in position sizing.
Orders are instructions, not guarantees
Market orders prioritize execution but can fill far from the displayed quote. Limit orders control the worst acceptable price but may not fill. Stop orders can become market orders after triggering. Learn the exact behavior supported by your broker before using any order type in a fast market.
Account rules are in transition
Cash availability, settlement, margin, short-sale permissions, and intraday buying power depend on the account and broker. In the U.S., FINRA's new intraday margin standards took effect on June 4, 2026, with a permitted broker transition period through October 20, 2027. Do not rely on an old blog post: ask your broker which framework currently applies.
Read charts as compressed market evidence
Each candlestick summarizes open, high, low, and close for a selected interval. A one-minute chart reveals short-term movement but contains more noise; a five-minute or daily chart can make structure easier to see. Many traders inspect multiple intervals because a clean entry on one chart can run directly into resistance on another.
Price structure
Prior highs and lows, opening range, trend, consolidation, and failed breakouts.
Participation
Session volume, relative volume, pace, and whether volume expands or fades at key levels.
Reference levels
VWAP, moving averages, premarket levels, and support or resistance—used as context, never commands.
Indicators transform the same underlying price or volume data. Adding more indicators does not add independent truth. Use only the references that support a defined question, such as whether price is accepting above session VWAP or whether participation is increasing during a breakout attempt.
Use scanners to narrow attention, not outsource decisions
A screener usually answers a static query about a market universe. An intraday scanner repeatedly evaluates changing conditions and can surface new candidates as price and volume evolve. Neither one knows whether a trade fits your plan.
- Price and percentage change: enough movement to study, but not proof the move will continue.
- Session and relative volume: evidence of participation compared with a useful baseline.
- Spread and liquidity: whether the theoretical setup can be entered and exited responsibly.
- Float and market capitalization: context for supply and volatility when reliable data is available.
- Catalyst and filings: why attention may have changed and whether dilution, offering, or corporate-action risk exists.
- Chart location: distance from support, resistance, VWAP, premarket high, and the point that invalidates the idea.
A healthy watchlist is small enough to monitor. Re-rank it as regular-session liquidity arrives, remove extended or erratic names, and accept that “no qualified setup” is a valid scanner result.
Frameworks describe behavior; they do not predict it
Momentum continuation
Price is already moving with participation. The trader waits for structure that permits a defined invalidation rather than buying solely because the percentage change is large.
Key risk: Late entries, extension, failed breakouts, and sudden liquidity loss.
Pullback continuation
An initial move pauses or retraces. Attention shifts to the depth of the pullback, volume behavior, higher lows, and room before resistance.
Key risk: A pullback can become a trend reversal; support is not guaranteed.
VWAP reclaim or rejection
Price tests the session's volume-weighted reference. Traders look for acceptance and structure around the level instead of treating one print as confirmation.
Key risk: Repeated crossing can signal chop rather than direction.
Reversal
A trend shows evidence of exhaustion and changes structure. Calling a top or bottom without confirmation is not a setup; it is a guess.
Key risk: Fighting a strong trend can produce repeated small losses or one large loss.
Define the loss before calculating the size
Position size should come from the point that invalidates the setup and the maximum dollar loss allowed by the plan—not from a preferred share count. A basic planning equation is:
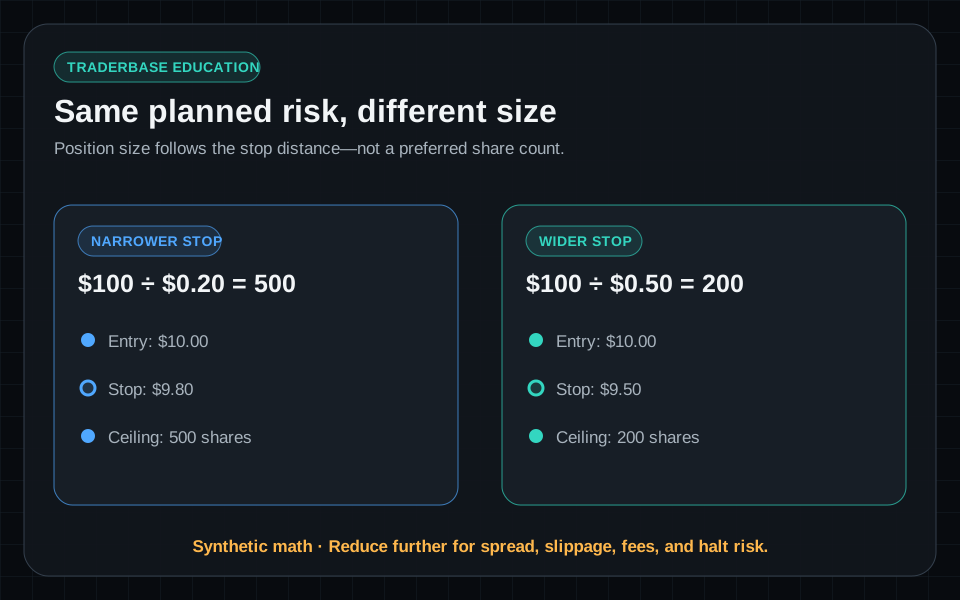
The result is only a ceiling. Reduce it for spread, slippage, low liquidity, halt risk, fees, correlated exposure, and broker constraints. A stop defines intent, not a guaranteed fill.
- Set per-trade and per-day loss limits before the session begins.
- Never move an invalidation farther away just to avoid realizing a loss.
- Treat leverage as a risk multiplier, not additional capital.
- Remember that short losses can grow as price rises and borrow availability can change.
- Separate process quality from P&L; a controlled loss can follow the plan, and a lucky gain can violate it.
Build a routine that can be audited
- 01PrepareCheck the market session, scheduled events, account constraints, and maximum risk for the day.
- 02DiscoverUse scanners to create candidates, then remove names that fail liquidity, structure, or catalyst checks.
- 03PlanWrite the trigger, invalidation, size ceiling, expected friction, and reason to skip.
- 04ObserveLet the market provide evidence. Missing a move is less damaging than inventing an entry.
- 05Execute or passFollow broker controls and the written risk. A no-trade decision is part of the process.
- 06Decide and monitorChoose whether to act, then keep the selected chart, scanner alerts, catalyst, and risk context connected.
Practice the operational routine in a simulator supplied by a broker or dedicated simulation product before risking money. Simulation cannot reproduce every emotion or fill, but it can expose order-entry errors and whether the written rules are actually measurable.
Your decision state belongs in the risk model
FOMO, revenge trading, overconfidence, loss aversion, and the urge to “make it back” can turn a defined plan into an unlimited one. The answer is not motivational language; it is operational friction that makes impulsive behavior harder.
- Use a written checklist before entry and a hard daily shutdown condition.
- Reduce size after errors instead of increasing it to recover losses.
- Take a timed break when physical stress or urgency appears.
- Track rule violations separately from winning and losing trades.
- Evaluate enough samples before changing a strategy; one outcome proves very little.
Connect scanning, alerts, chart context, and decisions
TraderBase is designed to keep scanner evidence connected. It does not replace a broker, simulator, or professional advice.
Scanner and screener
Filter active symbols and inspect the measurable reason an event appeared.
Chart context
Move from a symbol to multi-timeframe structure and configured indicator references.
Risk planning
Keep price, volume, float, catalyst, and invalidation context near the plan.
Streaming alerts
Receive timestamped supported market events and open the symbol without repeatedly refreshing a static list.
Explore the dashboard
Public account access will be available after launch.
Day-trading FAQ
Educational content only. Trading involves substantial risk, and scanner events are not recommendations to buy or sell securities.