traderbase
Stock ScannerPricing
Log inJoin interest list
All articles
Market mechanics/July 10, 2026/ 6 min read

The Hidden Cost Between the Chart and the Fill

Why spread, depth, speed, and slippage belong in the risk calculation before a trade is placed.

By TraderBase · Updated July 10, 2026

In this article

  1. 01A chart price is not a guaranteed fill
  2. 02Risk must include execution
  3. 03Validate liquidity before sizing
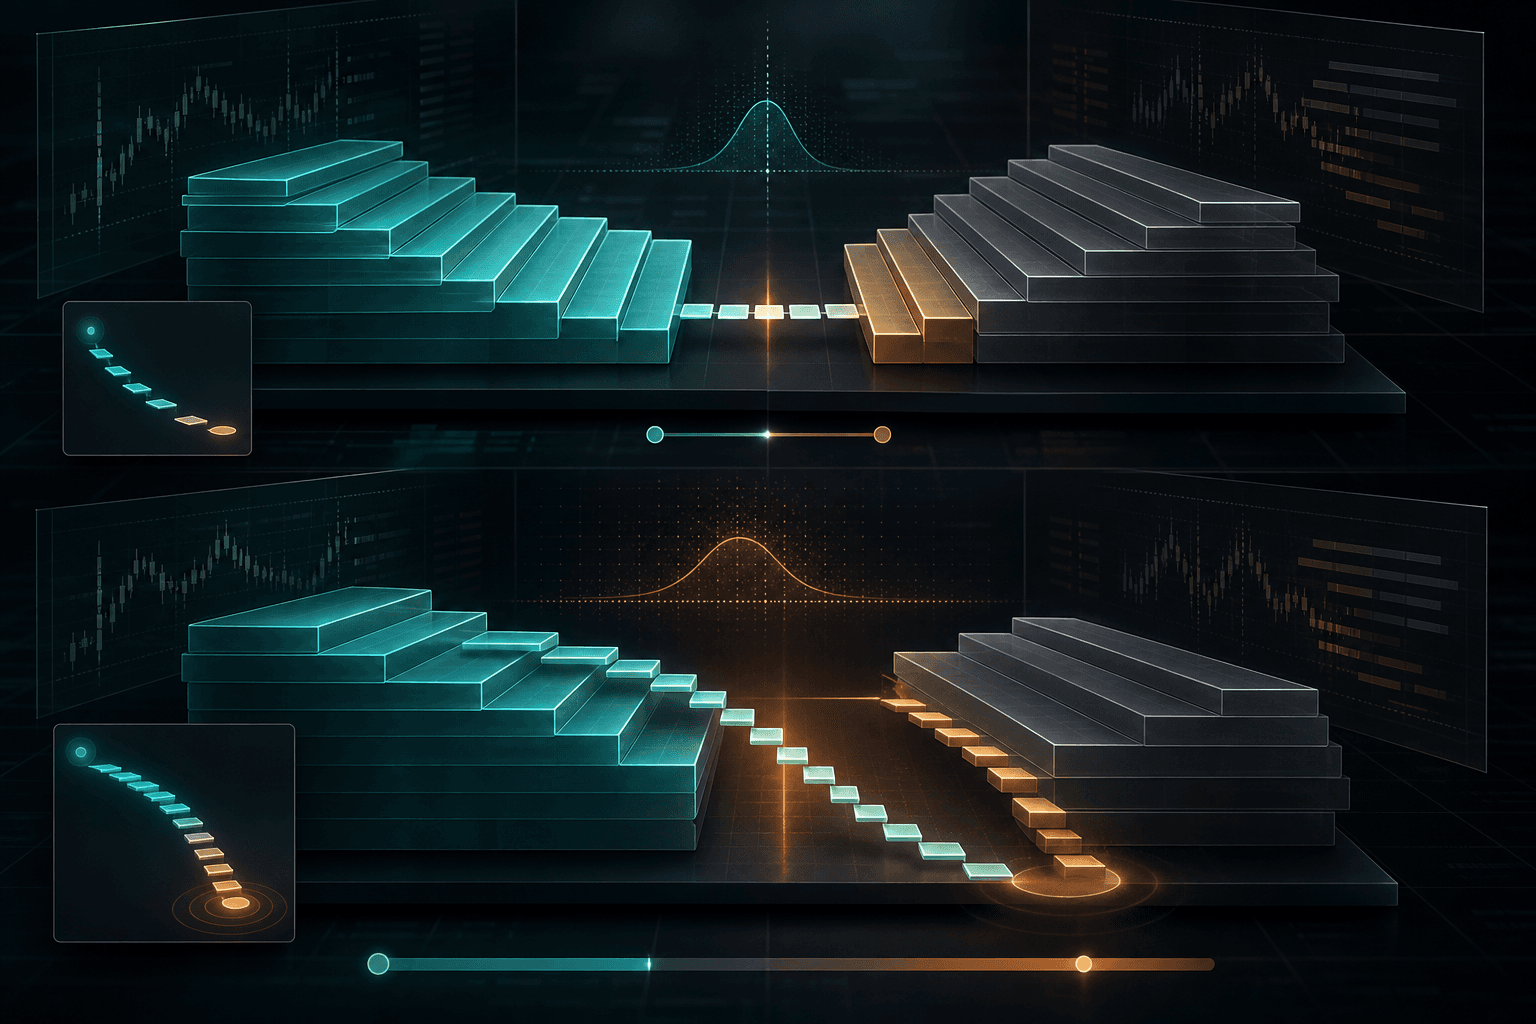
A narrow teal bid-ask bridge becoming wider as order size increases, illustrating spread and slippage.
A narrow teal bid-ask bridge becoming wider as order size increases, illustrating spread and slippage. Illustration by TraderBase.
01

A chart price is not a guaranteed fill

Candles summarize completed transactions. An order still interacts with the currently available bids and offers, and those prices can change before the order reaches the market.

The visible spread is the first execution cost. Slippage adds the difference between the expected price and the actual average fill, especially when size is large relative to available liquidity.
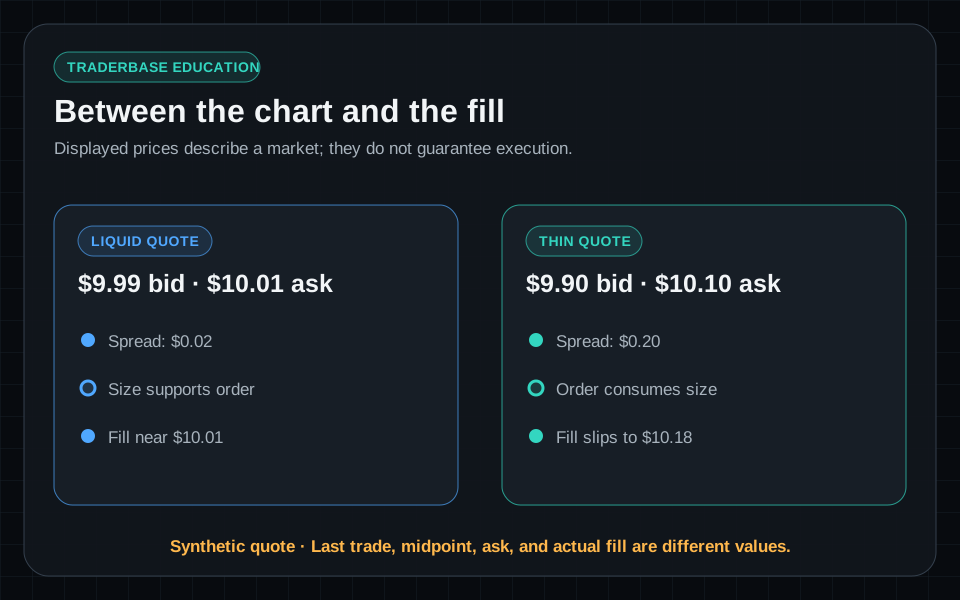
Quote and fill diagram distinguishing bid, midpoint, ask, spread, expected price, actual fill, and size impact.
The last chart print is not an executable promise; spread, available size, and order urgency affect the realized fill.
comparisonIllustrative example · Synthetic data · Not live market data
02

Risk must include execution

Position-sizing math based only on entry and stop can understate loss when the symbol moves quickly or has thin depth. A safer plan reduces theoretical size for expected spread, slippage, fees, and the possibility that an exit fills across several prices.

  • Observe spread stability, not one snapshot.
  • Compare planned size with visible and typical liquidity.
  • Assume fast markets can fill worse than the stop price.
  • Skip trades whose execution risk cannot be bounded.
03

Validate liquidity before sizing

A scanner result can surface activity, but it cannot guarantee executable liquidity. Inspect available quotes, reported prints, spread behavior, and chart speed before deciding whether a symbol can support the contemplated size.

Educational content only. Trading involves substantial risk, and scanner events are not recommendations to buy or sell securities.

Explore related scanner tools

Stock scanner Scanner documentation Related learning paths Plans and limits

Continue reading

Market mechanics

Relative Volume Needs Context

5 min read
Chart reading

VWAP Is Context, Not a Command

5 min read
View all articles

TraderBase is a stock-scanning and market-intelligence platform combining configurable momentum scanners, streaming alerts, and TradeBase Agent.

Product

  • Stock Scanner
  • Stock Alerts
  • Pricing

Resources

  • Blogs
  • RSS Feed
  • Learning Center
  • Documentation
  • Help Center
  • Changelog
  • Contact

Company

  • About
  • Security
  • Market Data
  • Roadmap
  • Status

Legal

  • Terms
  • Privacy
  • Privacy Request
  • Cookies
  • Refund Policy
  • Acceptable Use
  • Trading Disclaimer
TraderBase scanner outputs identify configured market conditions and can be delayed, stale, incomplete, unavailable, or incorrect. They are not personalized investment recommendations or instructions to buy or sell. TradeBase Agent does not place orders or manage positions. Generated content may contain errors and should be checked against cited sources. Data availability and timing depend on providers and account configuration. Trading securities can result in substantial loss. Legal and regulatory classifications remain under attorney review.
© 2026 TraderBase. All rights reserved.