TraderBase scanner docs
Scanner presets
Use implemented TraderBase presets for premarket, momentum, volume, low-float, VWAP, breakout, catalyst, earnings, and halt workflows.
Maintained by TraderBase · Updated
Implemented presets
TraderBase ships with implemented presets including Premarket Gappers, Top Gainers, High Relative Volume, Low Float Runners, HOD Momentum, Running Up, Top 5m Volume, News Catalyst Movers, Halt Watch, VWAP Reclaim, Gap and Go, Flat Top Breakouts, Buy Bull Flag, Buy Sudden Dips, ABCD Breakout, Short Spike / Resistance, Red to Green, and Earnings Movers.
Preset availability varies by plan. The interface is the authoritative list for your account.
What a preset does
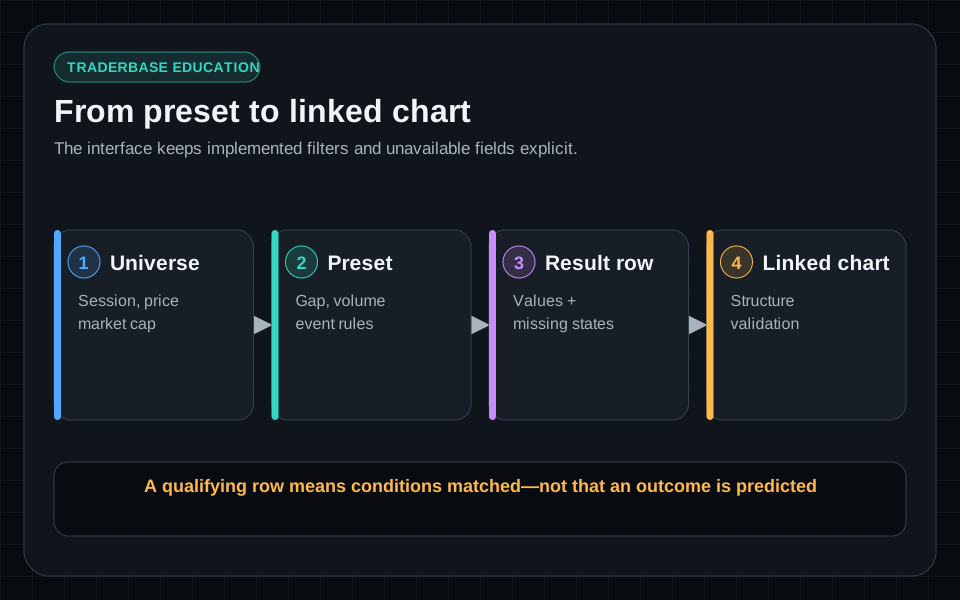
Each preset applies deterministic conditions to available market data. A matching row means the symbol satisfied those configured conditions; it is not a prediction, recommendation, or instruction to trade.
Provider fields can be unavailable. TraderBase keeps missing float, news, earnings, and other context distinct rather than inventing a value.
How to read a ranked scanner table
A ranked scanner is a current-state view. It keeps one row per symbol and reorders or removes rows as measurements change. Read each row from evidence to context instead of treating the first symbol or highest score as an instruction.
- Confirm freshness. Check the scanner connection badge, market session, row Status, and Updated time. A strong-looking row with an old timestamp may no longer describe the current state.
- Measure the move. Use Chg, Price, Gap, and PM % to understand how far the symbol moved and which session contributed to it.
- Check participation. Compare RVOL, share Vol, and $ Vol. Relative volume measures activity against a baseline; dollar volume adds price context. Neither guarantees a narrow spread or executable liquidity.
- Read structure. VWAP, High, Low, and Range show where price sits inside the observed session. Setup tags such as Near HOD, Above VWAP, High RVOL, or 5m Volume summarize measured conditions, not predictions.
- Inspect supply and context. Mkt cap, Float, and News can help explain the type of move. A dash means the field is unavailable, not zero. Float and catalyst data can be stale or incomplete.
- Use Score last. Score combines supported quality inputs for ranking. Open the row and validate the underlying measurements instead of relying on the number alone.
Column headers can be sorted where supported, and the options sheet controls visible columns, density, timezone, and metric tiers.
- 1General controls set scanner identity, enabled state, pause state, and display time zone.
- 2Density, maximum rows, and auto-scroll control the ranked-list presentation.
- 3Alert-display controls change row emphasis without changing qualification logic.
- 4RVOL, gap, float, and range tiers apply explicit metric emphasis.
Find a type of stock without overfitting
Start with the preset that describes the market behavior, then narrow it with measurements that answer a specific question:
- Active gappers: begin with Premarket Gappers or Gap and Go, then compare gap, premarket percentage, RVOL, share volume, and dollar volume.
- Liquid momentum: use Top Gainers, Running Up, or High RVOL, then require current timestamps and inspect dollar volume, spread, VWAP, and chart structure.
- Stocks near the session high: use HOD Momentum or New High of Day, then check the Near HOD tag, day high, range position, volume, and time of the latest event.
- Low-float activity: use Low Float Runners, but pair reported float with float turnover, dollar volume, spread, offerings, reverse splits, and halt context.
- Catalyst-driven movement: use News Catalyst Movers or the News feed, then open the publisher, received time, headline, and ticker workspace.
Avoid stacking conditions merely because they describe one historical winner. Each filter should have a clear job, and unavailable inputs should remain visible as missing.
Explain a row with Agent
Select a row to link it to the workspace, then use Explain with Agent or open the Agent sidebar. Ask for the row's match reasons, relative volume, dollar volume, range position, catalyst availability, and freshness. The response should explain the deterministic evidence and missing fields without recommending a trade.
From result to chart
Click a scanner row to update linked Workspace charts. Click the ticker to open its focused ticker page with available volume, VWAP, news, SEC filings, offering context, and halt information.
Scanner stacks
Choose Add from the Scanners workspace to place up to four scanners in the same workspace. Each panel keeps its own ranking, universe filters, columns, and display settings. Use the arrow controls to reorder panels or the remove control to return to a smaller stack.
Scanner stacks are stored in the page URL, so refreshing or sharing the URL preserves the selected scanners and their order. On smaller screens, panels become a vertically scrollable feed.
Read Streaming alerts for timestamp and notification behavior.