
Unusual is not automatically actionable
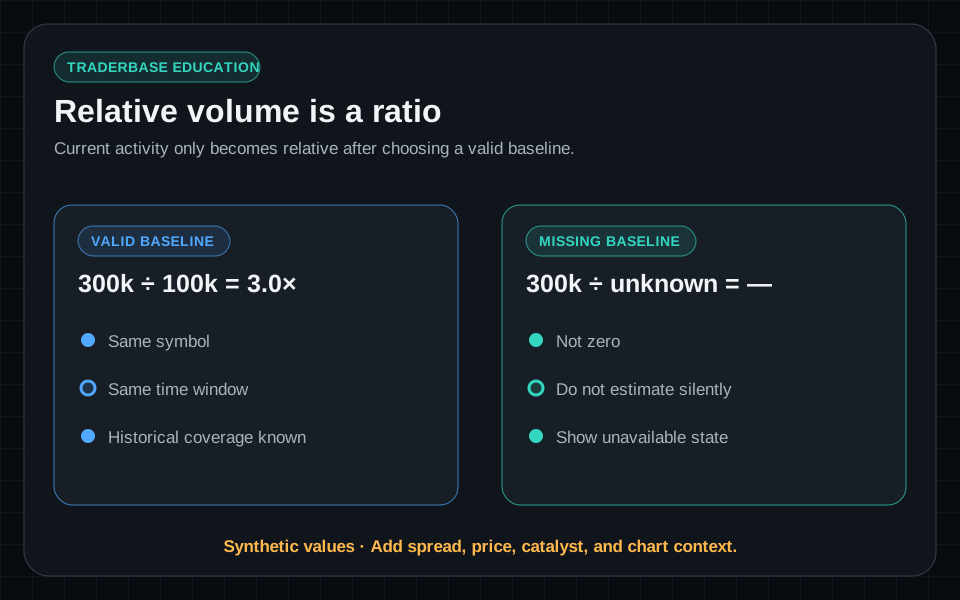
Relative volume compares current participation with a relevant historical baseline. It can reveal that a symbol deserves attention, but it does not say whether buyers or sellers will control the next move.
The comparison also changes through the session. Volume that is exceptional early may look ordinary by midday, while one block print can distort a thin symbol without creating durable liquidity.
Pair participation with tradability
Ask whether the activity produces tighter spreads, reliable prints, and enough depth for the planned size. Then compare price with session structure: a stock can trade enormous volume while repeatedly failing the same level.
- Check the time-of-day baseline.
- Distinguish sustained participation from one isolated print.
- Observe spread and liquidity before choosing size.
- Use catalyst information as context, not certainty.
Let the scanner narrow the work
A scanner can rank unusual volume and price behavior, then the chart, filings, news, and offerings context help explain what deserves closer inspection. If the evidence remains unclear, removing the symbol is a valid decision.
Educational content only. Trading involves substantial risk, and scanner events are not recommendations to buy or sell securities.