traderbase
Stock ScannerPricing
Log inJoin interest list
All articles
Chart reading/July 11, 2026/ 6 min read

Plan the Opening Range Before You Trade the Break

A structured way to read the first minutes of regular trading without treating every new high as confirmation.

By TraderBase · Updated July 11, 2026

In this article

  1. 01The range organizes evidence
  2. 02Separate a print from acceptance
  3. 03Evaluate the path, not only the outcome
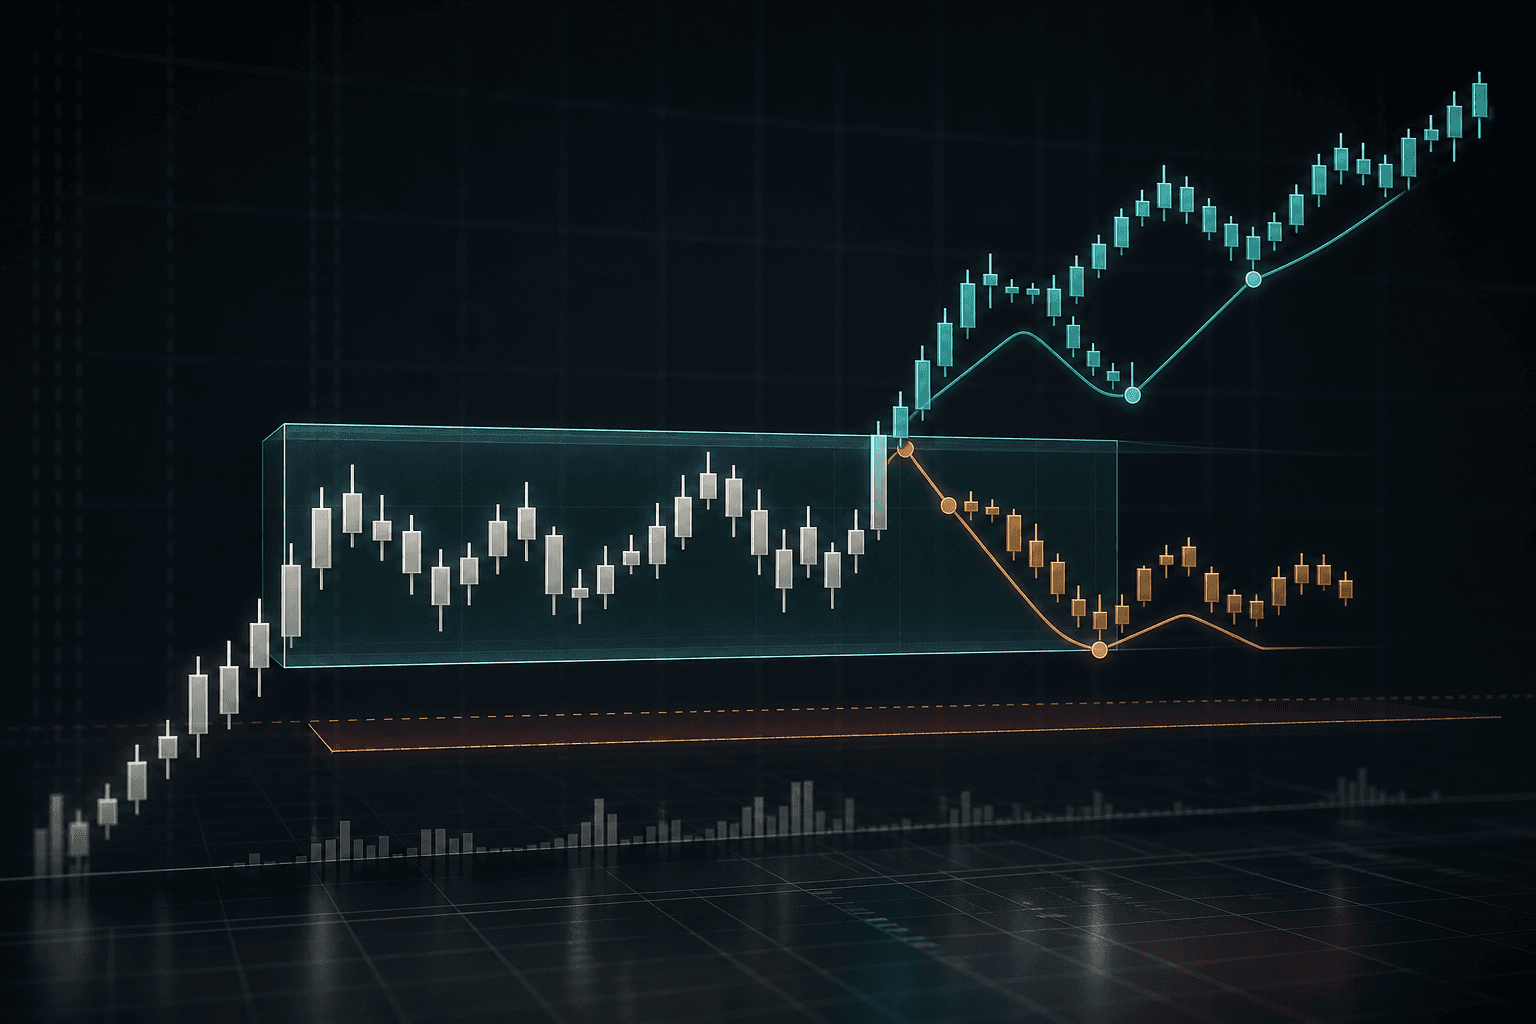
Candlesticks forming a measured opening range with breakout, retest, and invalidation paths.
Candlesticks forming a measured opening range with breakout, retest, and invalidation paths. Illustration by TraderBase.
01

The range organizes evidence

The opening range captures an early negotiation between buyers and sellers after regular-session liquidity arrives. Its high and low create reference points, but neither boundary predicts what happens next.

Before a possible break, note the range width, volume behavior, nearby premarket levels, and the distance to a logical invalidation point. A range that is already unusually wide may require smaller size or no trade.

02

Separate a print from acceptance

A single transaction above the range can reverse immediately. Stronger evidence includes sustained trade above the boundary, expanding participation, controlled pullbacks, and room before the next obvious resistance area.

  • Mark the range before deciding where to enter.
  • Use volume and price structure together.
  • Define failure inside or below the range before taking risk.
  • Avoid chasing when the stop distance no longer fits the plan.
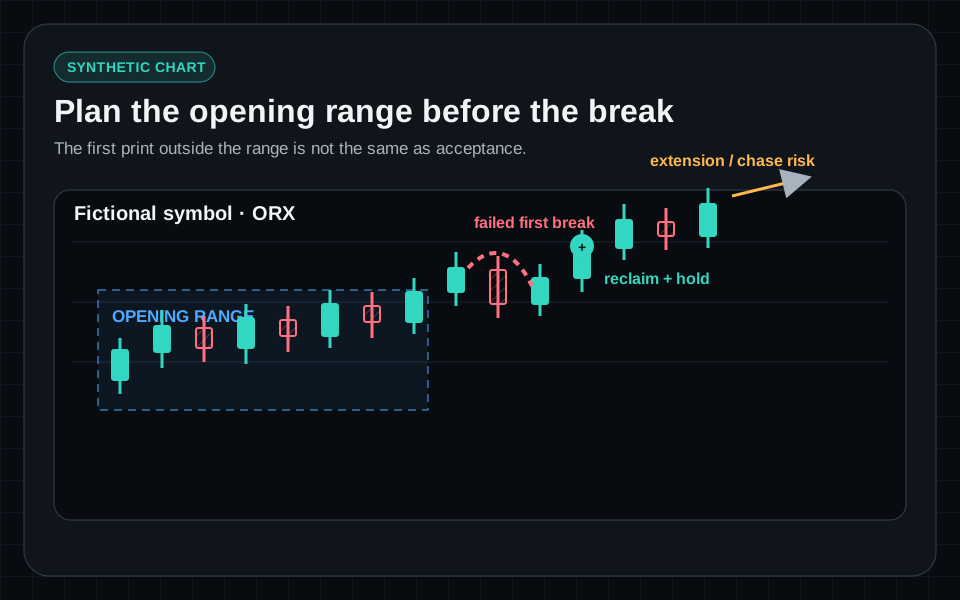
Synthetic opening-range chart labeling the range high and low, failed break, reclaim, confirmation, and extended chase area.
The opening range organizes evidence; a first print outside it is different from acceptance or a controlled reclaim.
synthetic chartIllustrative example · Synthetic data · Not live market data
03

Evaluate the path, not only the outcome

A profitable breakout can still be poorly executed if the entry was extended and the risk undefined. A planned loss can be well executed when the setup failed at the stated invalidation. Plotting executions on the chart makes that distinction visible.

Educational content only. Trading involves substantial risk, and scanner events are not recommendations to buy or sell securities.

Explore related scanner tools

Momentum scanner Scanner documentation Related learning paths Plans and limits

Continue reading

Chart reading

VWAP Is Context, Not a Command

5 min read
Risk management

Risk First: Size the Trade From the Stop

5 min read
View all articles

TraderBase is a stock-scanning and market-intelligence platform combining configurable momentum scanners, streaming alerts, and TradeBase Agent.

Product

  • Stock Scanner
  • Stock Alerts
  • Pricing

Resources

  • Blogs
  • RSS Feed
  • Learning Center
  • Documentation
  • Help Center
  • Changelog
  • Contact

Company

  • About
  • Security
  • Market Data
  • Roadmap
  • Status

Legal

  • Terms
  • Privacy
  • Privacy Request
  • Cookies
  • Refund Policy
  • Acceptable Use
  • Trading Disclaimer
TraderBase scanner outputs identify configured market conditions and can be delayed, stale, incomplete, unavailable, or incorrect. They are not personalized investment recommendations or instructions to buy or sell. TradeBase Agent does not place orders or manage positions. Generated content may contain errors and should be checked against cited sources. Data availability and timing depend on providers and account configuration. Trading securities can result in substantial loss. Legal and regulatory classifications remain under attorney review.
© 2026 TraderBase. All rights reserved.