traderbase
Stock ScannerPricing
Log inJoin interest list
All articles
Risk management/July 12, 2026/ 5 min read

Risk First: Size the Trade From the Stop

Why fixed-dollar risk produces more consistent exposure than fixed share size when volatility changes.

By TraderBase · Updated July 12, 2026

In this article

  1. 01Define failure before reward
  2. 02The sizing equation
  3. 03Let volatility change size, not discipline
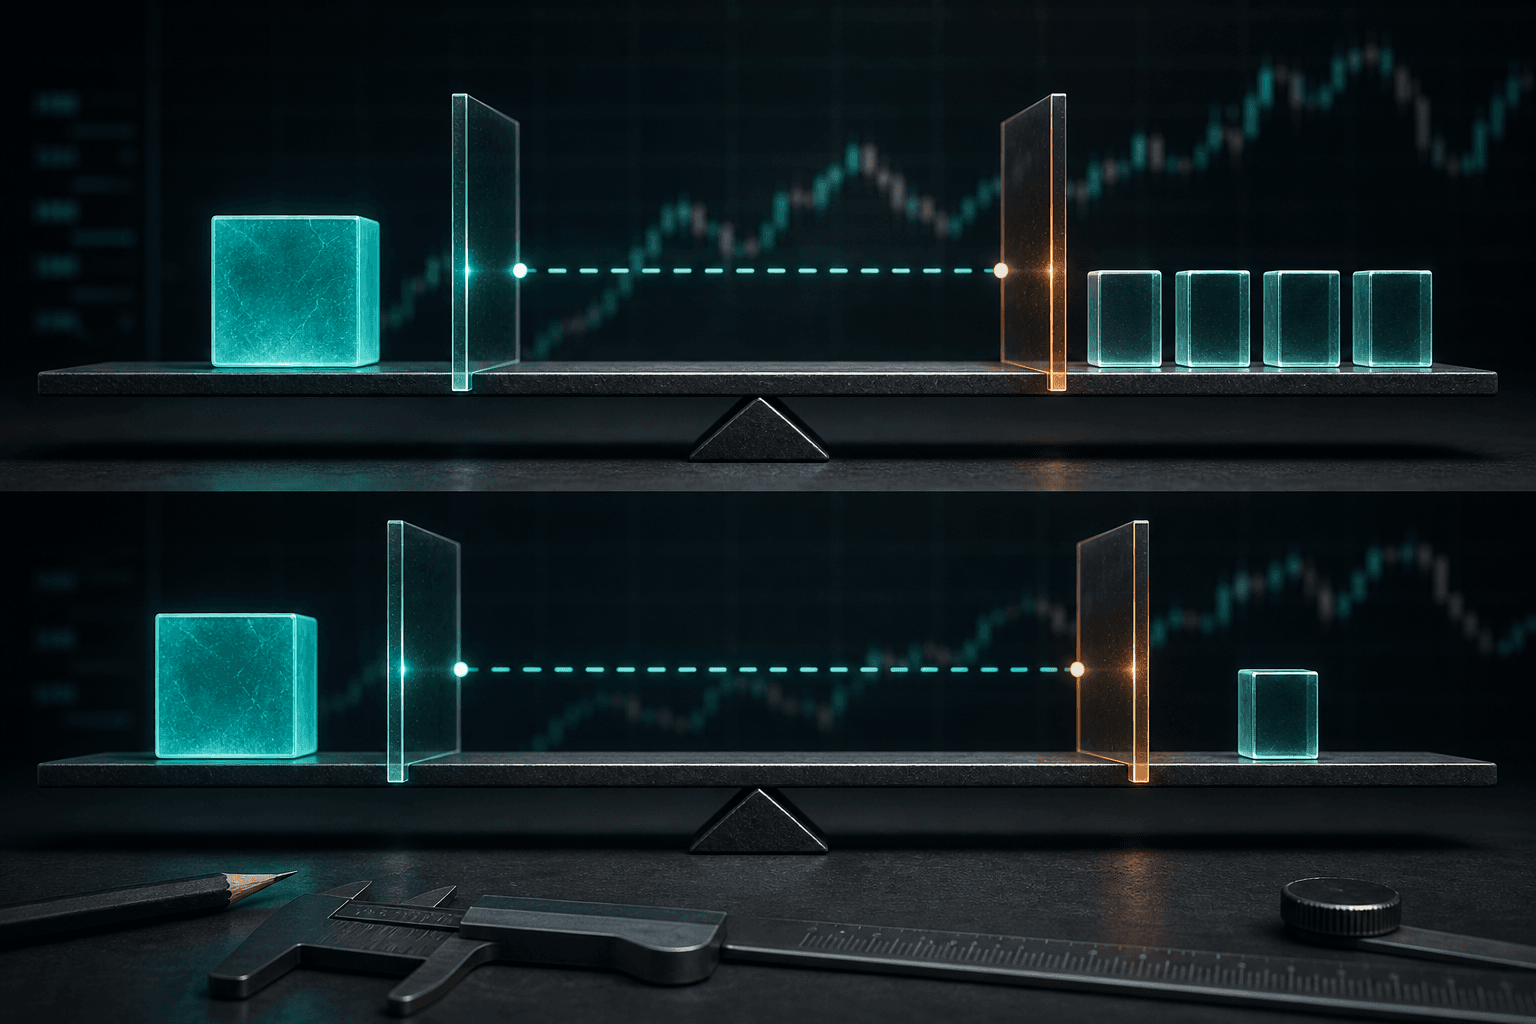
A precision balance comparing one teal block with a measured group of graphite blocks.
A precision balance comparing one teal block with a measured group of graphite blocks. Illustration by TraderBase.
01

Define failure before reward

A setup is incomplete until it has a price that proves the thesis wrong. That invalidation level determines stop distance. Stop distance, together with the maximum acceptable dollar loss, determines position size.

This order matters. Choosing shares first and discovering the risk afterward makes exposure expand on volatile stocks—the exact moment when execution and slippage are least forgiving.

02

The sizing equation

Position size is maximum dollar risk divided by the distance between entry and stop. If the account permits $100 of planned risk and the stop is $0.40 away, the theoretical size is 250 shares. Fees, expected slippage, liquidity, and broker constraints should reduce that number rather than increase it.

  • Set a per-trade loss ceiling before the session.
  • Set a daily stop that prevents one difficult session from escalating.
  • Never move a stop farther away solely to avoid taking the planned loss.
  • Grade execution separately from P&L; a controlled loss can be a well-executed trade.
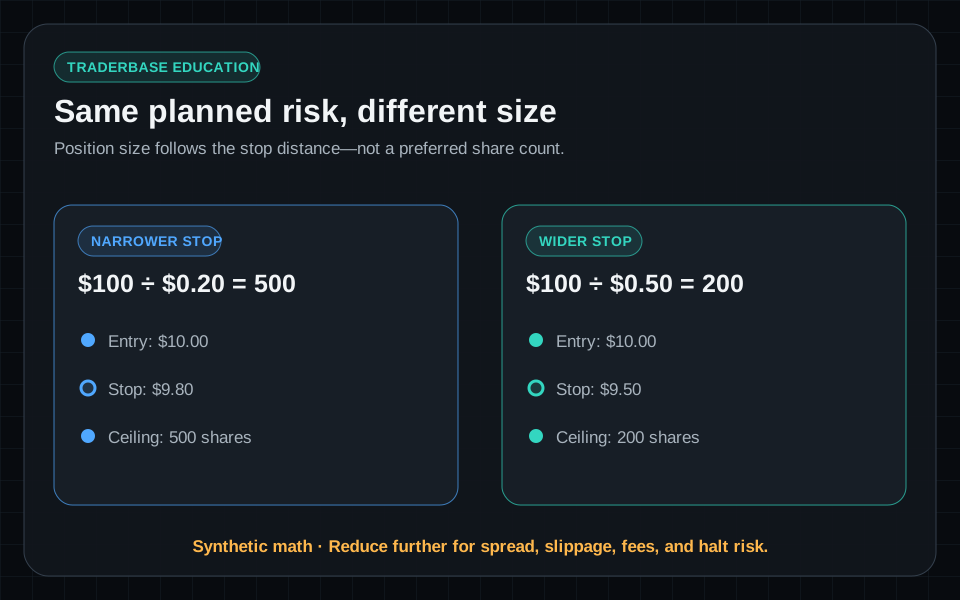
Position-size equation comparing narrow and wide stop distances while keeping the same planned dollar risk.
A wider stop reduces share size when planned dollar risk stays fixed; estimated slippage belongs inside the risk distance.
comparisonIllustrative example · Synthetic data · Not live market data
03

Let volatility change size, not discipline

Two charts can show the same pattern while requiring very different share sizes. Wider candles and faster tape require more room, so the theoretical position must shrink if dollar risk is to remain stable. TraderBase keeps the selected scanner symbol linked to chart, volume, VWAP, catalyst, and risk context so those assumptions can be checked together.

Educational content only. Trading involves substantial risk, and scanner events are not recommendations to buy or sell securities.

Explore related scanner tools

Stock scanner Scanner documentation Related learning paths Plans and limits

Continue reading

Chart reading

Plan the Opening Range Before You Trade the Break

6 min read
Scanner fundamentals

Stock Scanner vs. Stock Screener: What Changes in Real Time?

8 min read
View all articles

TraderBase is a stock-scanning and market-intelligence platform combining configurable momentum scanners, streaming alerts, and TradeBase Agent.

Product

  • Stock Scanner
  • Stock Alerts
  • Pricing

Resources

  • Blogs
  • RSS Feed
  • Learning Center
  • Documentation
  • Help Center
  • Changelog
  • Contact

Company

  • About
  • Security
  • Market Data
  • Roadmap
  • Status

Legal

  • Terms
  • Privacy
  • Privacy Request
  • Cookies
  • Refund Policy
  • Acceptable Use
  • Trading Disclaimer
TraderBase scanner outputs identify configured market conditions and can be delayed, stale, incomplete, unavailable, or incorrect. They are not personalized investment recommendations or instructions to buy or sell. TradeBase Agent does not place orders or manage positions. Generated content may contain errors and should be checked against cited sources. Data availability and timing depend on providers and account configuration. Trading securities can result in substantial loss. Legal and regulatory classifications remain under attorney review.
© 2026 TraderBase. All rights reserved.